
Exploring the Environmental Business Model of Bluebikes in Massachusetts
Abstract: This article was written as a more speculative and hypothetical piece to accompany a data visualization project that I completed in September of 2025 (Bluebikes in the Past 5 Years). For a more comprehensive overview of the Bluebikes system and its changes after the COVID-19 pandemic, please refer to the above link. This article expands the project with additional primary and secondary sources to review the Bluebikes system as a public entrepreneurship endeavor. The recommendations, speculations, and hypotheticals within this article are limited in accuracy due to a lack of publicly available knowledge of profits and exact expenditures and, therefore, cannot be viewed as more than an abstraction of the Bluebikes system, not a full analysis of it. This article consists of three parts: I: outlining the environmental elements and benefits of Bluebikes, II: describing Bluebikes as public entrepreneurship, and III: theorizing about potential improvements to Bluebikes.
Part I – Environmental Overview
As an alternative means of transportation to cars, buses, trains, and rideshares, bicycles present a very energy-efficient way to get around (McCauley 2017). To reduce reliance on emissions-heavy modes of transport, many cities like Boston have introduced bike share programs to encourage citizens to use a bike who may not otherwise. In addition, the introduction of e-bikes into bikesharing systems gives users one more way to substitute higher emissions modes of transportation for lower ones (Li, Fuerst, and Luca 2023).
For these sustainability reasons, and because of a recently growing preference for bike infrastructure, especially in Cambridge, in 2011, Boston, Somerville, Cambridge, and Brookline, Massachusetts, decided to create Bluebikes (then called Hubway) as a sustainable alternative for citizens to get to work, see the city, or go for a relaxing bike ride. Bostonians can select from 550 docked stations, including those in neighboring cities and towns that also have Bluebikes, and 5,300 bikes. According to the city of Boston, “Our riders have taken more than 25 million trips via bike share since launch, including more than 4.7 million in 2024 alone” (City of Boston 2025). To compare the bikes to other modes of transportation, let’s start with the month of September 2024—one of the most popular months to use Bluebikes and other forms of public transportation. (Clemens 2025) (MBTA 2025). On the average weekday of September 2024, there were 465,141 rides taken on the subway, 331,670 rides taken by bus, 113,439 taken on the commuter rail, 4,078 taken on The RIDE, and 5,607 taken by ferry (these numbers count round trips as two, and trips taken on multiple modes of transport as one for each mode of transport, i.e. one individual commuting from bus to train counts a trip for both the bus and train)(MBTA 2025). In comparison, there were about 20,284 rides taken on Bluebikes on the average weekday in September 2024, representing a significant, but still not incredibly prominent chunk of public transportation (Clemens 2025). Although no solid monthly data is available for the exact number of cars entering the city during the day, NBC News Boston reported that “The Massachusetts Department of Transportation says 95% of all drivers [from pre-covid levels] are now on the roads, which means that on any given day there are roughly 750,000 people commuting into the city,” (Tran 2023). (It is important to note that this number is a loose approximation and not a precise measurement.) The estimate does not account for carpooling, which in 2014 was the case for about 11% of cars commuting to the city, according to Boston Today (2017). This means the true number of cars entering the city during any given day could fluctuate. Even if only 600,000 people (a lower estimate) commute by car, car travel is still by far the most popular way to get to and from Boston.
The work of the Bluebikes system, therefore, is quite important, considering that transportation by car is far worse than any other mode of transportation. One study by Ding et. al. (2025) found that Bluebikes resulted in “reductions in CO2 and NOX emissions [which]... followed an upward trend, from 703.25 and 1.49 tons in 2018 to 1694.25 and 3.66 tons in 2024.” For comparison, the average Bostonian emits around 8 metric tons (8.81 U.S. tons) of CO2 per year, according to the city of Boston in 2022 (down from 14 in 2005). In combination with the increase in ridership that Bluebikes has seen in recent years, this is a promising note for the sustainability of Boston.
However, “this study is limited to evaluating the operational phase of the Bluebikes without considering the carbon footprint of the production and recycling stages,” (Ding et. al., 2025). Thankfully, D’Almeida, Rye, and Pomponi (2021) found, “Across most impact categories, the environmental intensity of the use phase is the single most influential variable (97.1 %). Within this, carbon emissions from human activity represent 97.2 % of the use period emissions and therefore 94.5 % of all emissions.” In other words, the amount of carbon emitted from producing a Bluebike is far outweighed by the amount of carbon it takes for a human to ride one, measured by the calories burned by riding, and the emissions it took to produce the food for those calories, over the period of five years examined in the study. This is not to say that sustainable practices could not be implemented successfully in the production or recycling of Bluebikes, or that the sourcing of the materials for the bikes is negligible. However, one can certainly recognize that the lowered environmental and economic cost of production and upkeep of a bike is significantly less than that of a car, bus, or subway.
Finally, as I will examine further in Part III, electric bikes have produced a great opportunity for Bluebikes. After their introduction in December of 2023, e-bikes have become increasingly popular, especially in winter months, where they see less of a reduction in use than normal, non-electric bikes (Clemens 2025). Due to the recency of their introduction, studies have shown ambiguous results on the replacement of traditional methods of travel by e-bikes. Because they source their electricity only partially from solar, and the rest from a mixed greenhouse emitting grid, they are less environmentally friendly, both in operational and production cost, than non-e-bikes (Bluebikes 2025). This means e-bikes have the potential to increase emissions, provided that the only people using them would have used a non-e-bike if they did not have the option to use an e-bike. In other words, the success of the e-bike program must be measured in its ability to replace higher-emission modes of transportation (cars and sometimes public transportation) while subtracting the added emissions by its replacement of lower-emitting modes of transportation (non-e-bikes).
To decidedly show that e-bikes are indeed sustainable, a study conducted by Li, Fuerst, and Luca (2023) in Kunming and Chengdu, China, found:
“Although a larger proportion of e-bike sharing trips substitute green modes for high-carbon-emission vehicles, the net emissions are reduced. This is because the travel distances of shared e-bike trips that replace cars are longer than those of the trips replacing low-carbon modes, such as walking or cycling, and shared e-bikes themselves are a low-carbon transportation mode, and the carbon emission parameter is small. Therefore, the emissions reduced by replacing one car trip are far greater than the emissions increased by replacing one bike/walking trip.”
However, they also highlighted the dependence of the reduction in emissions of e-bikes on many external factors, including building density, (lack of) diversity of land use, and accessibility of a given region. They found that e-bikes were more likely to be more sustainable in areas where they were more likely to replace car travel rather than sustainable travel (Li, Fuerst, and Luca 2023). In other words, areas where one was not likely to walk, or could not find access to all their needs without using a car, were more likely to have a reduction in emissions when introduced to e-bikes, “potentially because shared e-bikes in these regions are more likely to replace transport modes that rely on fossil energy.” The bottom line is that, no matter the variability of the level of sustainability, e-bikes are a step in the right direction.
Part II – Public-Private Business Review
Of course, Bluebikes isn’t just an environmental or transportation initiative—it is also a venture in public entrepreneurship, if done right. Despite being managed by the municipalities in which it operates, in an operational partnership with bike-share company Motivate (meaning that it is technically a public program, but Motivate’s parent company Lyft covers “fundraising, operations, marketing and equipment provision” [Metropolitan Area Planning Council 2025]), Bluebikes can be a for-profit enterprise. According to the Metropolitan Area Planning Council’s (MPAC) 2025 Request for Proposals, intended to renegotiate operating contracts, Bluebikes generated $11,830,220.75 (although, while using their own numbers provided, I found it was closer to $12,372,692.84). As per the 2017 agreement between the city of Cambridge receives its fair share of 10% of the excess of any cumulative annual title sponsorship over $6,000,000 (the current is $2,473,118.26 however cumulative refers to total amount received from each year), 10% of the excess of annual subscriber revenues over $3,000,000, and 10% of all Secondary Sponsorship Funds for such Contract Fiscal Year. The share that each city receives from this 10% is dictated by the Regional Memorandum of Agreement between Bluebikes’ owner municipalities. The 10% cut that municipalities receive from revenue is earmarked to be reinvested into Bluebikes. After this cut was taken in 2024, Motivate received around $11,341,065.41 pre-tax, assuming that daily passes are counted under “subscriber revenues” as they did not exist when the 2017 contract was written, and excluding any revenues made from secondary donations or purchasing of stations (exact values either negligible or unknown) (MPAC 2025).
Because Bluebikes is publicly owned, but operated by Lyft, the exact profit generated from the program is unclear; although Lyft's proposal to maintain operational management of the system indicates that it “has reached a scale where its own revenues can cover the system’s entire day-to-day operation costs without taxpayer subsidy,” (MilNeil 2025). To renew their contract in 2025, Lyft and a competing company “presented business plans where user and sponsor revenues would cover all of the day-to-day operations costs of Bluebikes. Those costs presumably include a profit margin for the private-sector operators,” (MilNeil 2025). In their attempt to secure their contract, Lyft’s bid indicates that Bluebikes can be managed profitably (and has been in the past, ignoring the possibility that securing the bid is not just a way to temporarily boost shareholder value, especially considering Lyft has only recently overcome its profitability problems [Jagielski 2025]). “Additionally, Lyft's proposal would contribute $2 to $3 million a year in surplus revenues back to the municipal owners of the system to help cover the costs of new bikes and docking equipment for the system's expansion,” (MilNeil 2025). This recent bid indicates that the business model of such an endeavor can be profitable and beneficial to both private operators and public owners. If negotiated correctly, Bluebikes can be an investment in the future of the municipalities it operates in, both financially and economically.
There are two main ways in which Bluebikes generates its profits: sponsorships or donations and user payments. As of the writing of this article, Blue Cross Blue Shield Massachusetts extended its titleship sponsorship in 2023 for 28$ million to 2031 ($2,473,118.26 annually post-tax) (MPAC 2025)(PR Newswire 2023)(Citizen Portal AI 2025). Although it cannot be considered part of the revenue stream, it is important to take into consideration the amount of government funding that has been allocated for various Bluebikes projects, such as Boston Mayor Wu’s 1.4 million earmarked in 2023 to introduce e-bikes into the system (MilNeil 2023). Additionally, municipalities may invest in Bluebikes through their own departments, such as Cambridge’s community development department, which, in the Cambridge FY 2026 submitted budget, was named alongside the Bluebikes program, with $269,650 of city resources. Or take, for example, the Massachusetts Gaming Commission Casino Mitigation Grant of $527,800, which, in addition to improving the areas around new casinos and centers for gambling, earmarked a portion of the grant to buy e-bikes for Bluebikes.
Finally, one important way that municipalities contribute to the profitability of the Bluebikes system is through analytics, management, and consulting (like this 2020 project from the Boston Transportation Department [BTD], link here). Although it is difficult to measure the impact of such programs, departments within municipalities such as Boston work behind the scenes to improve and make the system more efficient. The analysis of which funds for these departments go towards improving the Bluebikes system cannot be adequately measured in a cost-benefit analysis–for example, the BTD’s budget was about 28.6 million dollars, separated into categories allocated for Personnel Services, Contractual Services, Supplies & Materials, Current Charges & Obligations, Equipment, Fixed Expenses, and Other Expenses; none of these definitively representing Bluebikes.
The cost of operating the Bluebikes system is similarly difficult to estimate, as the division between public ownership and private operation presents a challenge in business analysis. However, there are a few important costs to keep in mind in the business of Bluebikes: the cost of manufacturing a bike, the cost of creating a station, the upkeep of the bikes (such as moving them around and fixing broken equipment), and the introduction of e-bikes and e-bike stations. First, according to the 2017 contract with Motivate, the price of a bike could be as low as $1,161 when ordered in bulk. It is presumably more expensive to buy an electric bike, about $300 to $1000 more, depending on what type of e-bike the system ordered (Huang 2025), although the 2017 contract prohibits the purchase of e-bikes exceeding $3,000. According to Lyft, the cost of electrifying a docking station in New York City can be up to $100,000, depending on the location and the amount of construction needed to do so (this can be similarly assumed to be true in the dense downtown areas of Boston, Cambridge, and Somerville) (Vanderbilt 2023). There are also upkeep costs of maintaining the bikes, which can range to be about $100-200 per year on average per bike (Famuyide 2022). This is in addition to the cost of upkeep for the docking stations, which could range from around $1,200-1,500 per year, although municipalities currently cover $660 per dock per year of operational and maintenance costs (MPAC 2025)(City of Redmond 2016). The purchase of a new station (non-electric) is about $25-30,000, depending on the number of docks (City of Cambridge 2017). The city of Redmond, Washington, evaluated (2016) the five-year cost of a hypothetical bikesharing system with 40 stations, 648 docks, and 360 bikes to be around $5,791,600–about $4 million of which is associated with the operation costs of the system. This did not include an estimate for the payroll of personnel, nor customer service, nor discounted passes for students, nor to provide opportunities for disadvantaged communities. According to the Better Bike Share Partnership, these factors, unexamined by Redmond, are some of the more expensive parts of a Bikeshare system (as shown by the Denver ‘B-Cycle’) (Andersen 2016).
Taking into consideration all of these factors, I constructed a hypothetical Sankey diagram of the profits and costs of Bluebikes since its conception. Please keep in mind: the scale is not accurate, but based on loose understandings of cost, the diagram is only intended to show a rough flow of costs and sources of financial support of the Bluebikes system. The profits of this system go partially to Lyft, and the data on which I have based the expenses of Bikeshare systems is incredibly dependent on geographic, external, and temporal factors.

In this diagram, I assume multiple things: first, that corporate sponsors generally give money directly to the system, not just purchasing new bikes/stations. Second, I assume (based on Cambridge’s 2017 agreement with Motivate) that municipalities pay for part of all of the upkeep of the system (such as making a station electric) and not that Motivate fronts their entire cost. Third, I assume that government grants only go toward purchasing new bikes and stations as they are earmarked. This chart may only be helpful to illustrate a possibility for what Bluebikes could be—I hesitate to say that this is what it actually is today without further public information. On top of 6 million earmarked for Hubway in 2011, more federal funds have been continuously added, like those in 2024, to reduce traffic congestion, including part for purchasing new e-bikes; however, it is unclear how much of those funds actually ended up with Bluebikes (MilNiel 2024). Most importantly, without exact cost totals, I can only presume that Bluebikes is profitable with all of the local government and sponsorship funding.
Additionally, what I hope to illustrate with this diagram is the amount of work that goes into Bluebikes behind the scenes to keep it profitable for Lyft (departments such as BTD do lots of analytical work and monitoring on Bluebikes, and municipalities cover part of the cost of operations and maintenance). As it is additionally an environmental initiative, I hope this does not discourage one from viewing it as an economic benefit to both its public owners and its private operator. Cities receive numerous economic benefits aside from simply the profits of the bikesharing system, such as reduced congestion and travel times for workers (Ding et. al. 2025). Bike infrastructure, including bikeshare systems, can also help local businesses. According to Cambridge Bicycle Safety, “Eight studies comparing visitor spending by travel mode found that cyclists and pedestrians generally spend similar amounts or more per month in commercial areas compared to visitors who arrive by car or transit,” (Sheng 2021). Bike share is both an entrepreneurial venture for the public and an investment in the community (economic and environmental).
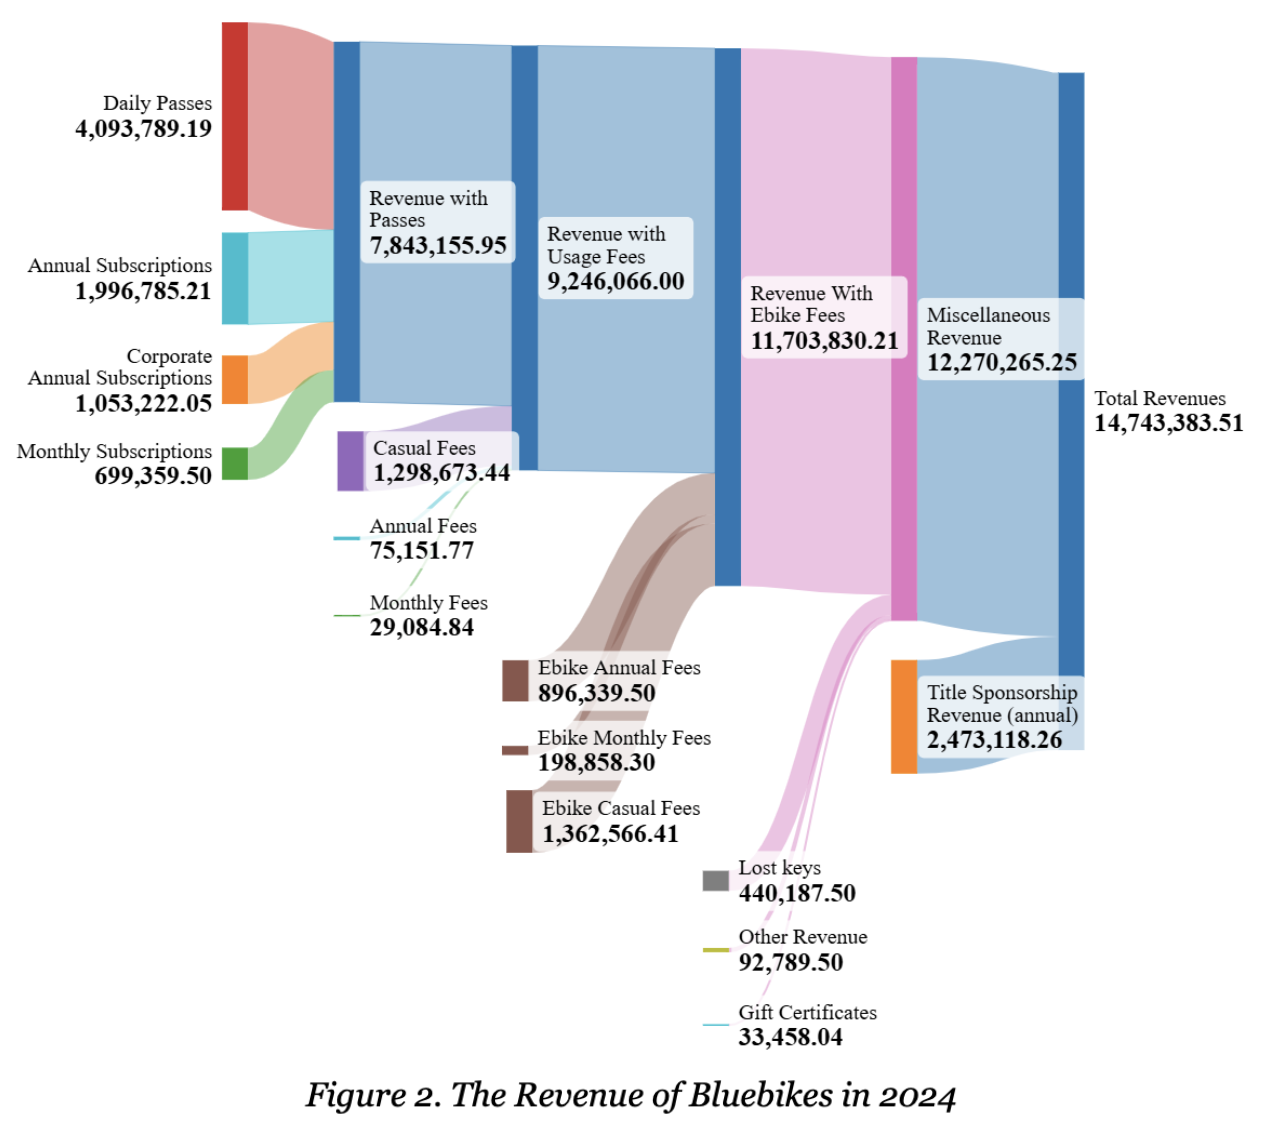
Below is a second diagram with known revenue streams from 2024. The first diagram was incomplete and not to scale because I did not know the exact amounts each municipality invested into the system or the exact cost of operations (municipalities currently contribute about $55/dock/month as per the 2024 Request for Proposals).
It is no wonder that many other bike share systems with more publicly available information show structural support from public funding, especially at the beginning of their operations. In 2016, revenue from bike sharing in Chicago “only cover[ed] about 85 percent of the costs of the program,” at the time, “one of the highest rates in the nation,” (Beitsch 2016). The previously mentioned Denver B-Cycle, a private corporation in partnership with a government-funded non-profit, shut down in January of 2020 (Bosselman 2020). This system could be characterized by its initially proportionally high cost of operating payroll in comparison with customer service and transportation fees—an aspect of cost potentially partially covered in part by the municipalities in which Bluebikes operates (Andersen 2016). Although it may have only recently changed, a report from 2023 claims that bikeshare systems “today cannot go without subsidy if you want to have any semblance of a public policy goal,” (Scott Kubly, who helped “launch Capital Bikeshare in D.C. and Divvy in Chicago and later ran the Seattle Department of Transportation,” (Zipper 2023) said. “If you want it in low-income areas or if you want it to be price-competitive with a cab, you’re probably going to need to subsidize it,” (Zipper 2023). Although the profitability of bikesharing depends on the circumstances of the city, Bluebikes faces the same challenges as other bikeshare programs, and presumably has grappled with them in similar ways.
Ultimately, it may be best to think of Bluebikes as a public infrastructure investment, one that can foster economic growth but may incur initial costs that the public will have to face to some extent. The design philosophy in which these costs are managed can be described as a delicate balance between maximizing environmental benefits and fostering economic development. Following the latter model, Bluebikes has rightfully been understood by its municipalities as public entrepreneurship. It is an investment that can have economic returns, although unlike other traditional financial or business ventures, these returns may not be initially visible. Following the former model, Bluebikes has nearly limitless potential for transformative environmental change and has the ability to transform our society into a more sustainable and accessible one.
It is clear that these ideas have been fundamental to the management of Bluebikes in the past decade. As per the 2024 Request for Proposals, Bluebikes indicated that the operational costs of stations and bikes will no longer be covered by Boston, Cambridge, Somerville, or Brookline starting in the new contract, and other municipalities will start to pay less for operations and maintenance, whereas the operating party will have to front this cost more through user payments and sponsorships. This change to the flow of funds in Bluebikes indicates strongly that the revenue generated from user payments has increased to the point where municipalities can step back from fully financing Bluebikes as if it were a start-up. As described in the Request for Proposals, “economies of scale improve operational efficiency, stabilizing costs while revenue grows.”
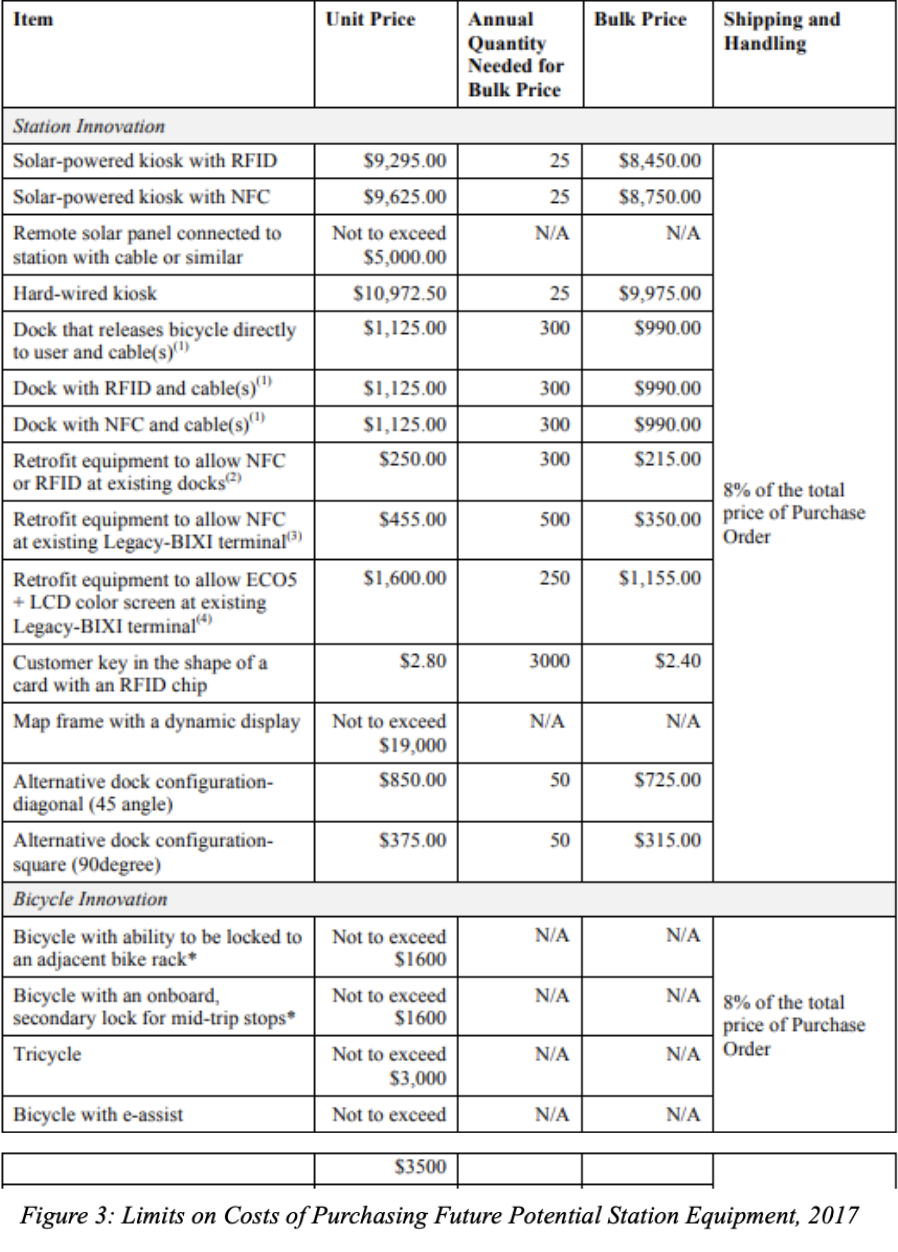
Below is an image of the list of costs of various items in the 2017 contract with Motivate. These values are not adjusted to inflation. These were received in a public records request made on November 3rd, 2025.

Part III – Hypothetical Environmental Business opportunities for improving Bluebikes
There is good reason to care about the profitability of Bluebikes, assuming (as Lyft also does) that profitability is linked to the expansion of the system, and an economy of scale (MilNeil 2025). Therefore, I can theorize about some potential ways forward for the Bluebikes system. However, I briefly want to qualify that I will not be talking about increasing programs for disadvantaged communities (although these are incredibly important, both socially and economically, and should be accepted as an integral part and cost of the program). I wish to focus on how, within this portrayal of Bluebikes as a public business, one could maximize its functionality.
Winter Weakness: Firstly, more than any other mode of transportation, biking is impacted by cold winter weather and snow. It is difficult to imagine how Bluebikes could remain competitive in a notorious Boston winter (total rides from September of 2024 to January and February 2025 fell from around 583,000 to around 162,000 and 166,000, respectively) (Clemens 2025). However, one small solution could be to introduce handlebar mittens to a small proportion of bikes, or to introduce heated seats in electric bikes, which remain more competitive in winter months as they shorten commuting times (Clemens 2025). Lyft or municipalities could outfit a small number of bikes with winter tires, accounting for the reduced ridership. These winter-style bikes should be concentrated in areas with stations with less high round-trip usage, which indicates recreational use (Clemens 2025). In the winter months, members can account for up to 85% of rides taken, whereas in the summer months, they are usually only 65%, indicating a higher level of commuter usage in the winter. Catering to membership commuters could help retain the competitiveness of Bluebikes and reduce the cost of unused bikes sitting in warehouses in the winter.
E-bike Excitement: As previously mentioned, e-bikes provide an important avenue for expanding bike share systems. Taking into consideration that “the emissions reduced by replacing one car trip are far greater than the emissions increased by replacing one bike/walking trip,” (Li, Fuerst, and Luca 2023), Bluebikes should target areas in which one may take a car instead of biking. Areas such as North Cambridge, Brookline, Jamaica Plain, Somerville, and Charlston are more likely to attempt to bike the full commute to their place of work, rather than commuting partially by bike and then by MBTA, if provided with more e-bikes. Areas within Newton, Arlington, Dorchester, Mattapan, Roxbury, Chelsea, Everett, and Hyde Park are more likely to commute by e-bike to the MBTA, as the stations become sparse and the distance from the average resident in these areas to the nearest MBTA station becomes not worth the effort to commute by bike. These are the areas in which most e-bikes should be centered, as they are more likely to replace car commuters than in more metropolitan areas, as Li, Fuerst, and Luca (2023) hypothesize.
The idea of targeting car-centric areas with e-bikes is also backed up by the data analysis that Ding et. al. (2025) provided: at a trip distance of 0.8-1.0 km, 56% of people walked, 22% of people drove, and 21% of people biked. However, at a distance of 1.0-1.5 km, only 25% of people walked, 19% of people biked, and 53% of people drove. As if it has switched at an instant, cars become the most prominent mode of transportation in the United States when people travel around 1 - 1.5km (roughly 0.62 and 0.93 miles respectively). Preference for bikes did not change significantly, indicating that the people who would have biked a shorter distance are not turned away from biking by a slight extra distance, meaning that cars replace the majority of walkers at this sweet spot of 1.0-1.5km. This study did not examine how e-bikes fit into this model, however Li, Fuerst, and Luca (2023) found that “The lowest estimate of carbon reduction from e-bikes occurs in the extreme scenario where all e-bike sharing trips with distances below 3 km replaced non-motorised travel modes, and the highest carbon reduction effect occurs when all trips with distances above 1 km replaced motorised travel modes.” Assuming then that the ideal range for e-bikes is about 1-3km, Bluebikes should concentrate on introducing e-bikes in areas 1-3km from the nearest T stop (the link of Bluebikes to the MBTA should not be ignored) (Clemens 2025)(A Better City TMA 2025). This would target people who would otherwise drive, and would generally occupy suburban areas with less mixed usage, meaning that residents would be able to go to grocery stores on e-bikes that are within a 1-3km range.
Dockless Development: The beginnings of this idea can be seen in Cambridge’s 2017 contract with Motivate, outlining the hypothetical cost of purchasing “bicycles with an onboard, secondary lock for mid-trip stops” as to not exceed 1,600$. As Cambridge now plans to place “‘stations within 1/8 mile of every resident or worker’” in the city, according to [Metropolitan Area Planning Council’s request for proposals],” it may be worth it to revisit the viability of a form of floating or dockless bike sharing. The idea is generally that, instead of using a docked return system, Bluebikes could allow users to return their bikes on the sidewalk, or even chained to a tree, alongside photo proof (or some other form) that they were adequately secured. Wang and Sun (2022) examined the environmental potential of a free-floating bike sharing system (FFBS), based on an examination of Beijing’s FFBS. They found that “The large-scale FFBS can contribute to the transition of urban transportation structure to sustainability… [However,] it requires reasonable and effective market supervision to make the FFBS system operational efficiency reach a high level. In the period of explosive growth without effective market supervision, FFBS has exerted a negative impact on urban transportation. Market chaos and oversupply led to low utilization of shared bicycles,” (Wang and Sun 2022). In other words, with proper supervision, an FFBS could be potentially beneficial for Bluebikes (eventually). Although not discussed, the financial costs incurred by such market supervision of an FFBS system could be too high for Bluebikes to implement, especially if Bluebikes only recently became profitable.
The chaos of FFBS could be what has prevented Bluebikes from attempting to go dockless, although if they want to maximize reductions in emissions, FFBS could be something to examine in the long term. For now, presumably because of market chaos, Bluebikes’ participating municipalities “are exclusively interested in maintaining a docked bikeshare system, no dockless bikeshare systems will be considered,” (MPAC 2025). As indicated in 2025, Cambridge could insist further on Lyft to revisit their 2017 agreement to purchase bikes that have temporary dockless locking systems, to allow customers to run errands in the middle of their ride. This would hopefully be implemented with a reduced or suspended cost during pauses in a ride, with the integral understanding that the bike would eventually return to a station after pauses.
Small Suggestions:
Bluebikes could introduce a party system where discounts are provided for riding with a friend. This would encourage groups of people to use Bluebikes rather than ordering an Uber or taxi to get from activity to activity.
MBTA could latch Bluebikes onto the front of the buses, and customers could check them out from inside the bus on the app. There are other ways Bluebikes could be better incorporated into the MBTA, but this is one of the more fun and possibly unrealistic ideas.
More on-site station equipment could be introduced for riders, such as detachable children’s bike seats or rentable on-location helmets. This would come with additional cost for the system, but allow certain people who would otherwise not use Bluebikes to consider using them, or help those who forgot equipment in a pinch.
Local corporate sponsors should be able to customize and decorate the docks at stations that they have funded. Additionally, although local sponsors can already purchase a new station for around $75,000, multiple sources should be able to pool funding for a station, like a group of local businesses that mutually benefit from Bluebikes' infrastructure. They could then decorate the stations, for instance, by painting the docks with murals themed to highlight local history and culture. This is prohibited under the current agreements between Motivate (Lyft) and Bluebike’s municipalities, but could be revised.
The popularity of leisurely recumbent tricycles is also something to explore, as was also mentioned as a possibility in Cambridge’s 2017 agreement. Cambridge signified that tricycles’ cost should not exceed $3,000. These could be recreational, accessibly designed tricycles for those with specific disabilities that prevent them from using bicycles, or two-seated tricycles designed with seats for parents to transport kids. If designed for recreational use, they could be rare and targeted at stations that have more round-trip usage, or near parks. It was indicated in 2024 that tricycles were desirable, but it was unclear what type of tricycle was envisioned.
Design Dependency: Finally, and most importantly, Bluebikes will not be able to expand without continued support from the communities and municipalities it is partnered with. One of the most important factors for any bikeshare to work is proper bike lanes (separated and divided bike lanes, not just painted onto the street next to a lane of cars) (Karpinski 2021). Infrastructure for bikes is the last part of the cost of Bluebikes that I did not include on the Sankey diagram. Due to the almost immeasurable amounts of funding poured into sustainable urban design, Bluebikes can operate and bring customers into its system. With the continuation of support for new bike lanes, and other bike infrastructure (overpasses, construction, etc.) Bluebikes will see more growth (Karpinski 2021). Without public support and new public projects, all other methods of trying to improve the profitability of Bluebikes will remain dreams. The best future for Bluebikes is a future with more support for biking in general.
References
A Better City TMA. 2025. “Bluebikes Support MBTA Shutdown.” A Better City TMA. TDM Innovation. Last accessed December 8, 2025. https://abctma.com/innovation/better-bikeshare-partnership
Andersen, Michael. 2016. “How much does each bike share ride cost a system? Let’s do the math.” Better Bike Share Partnership. Stories. August 16, 2016. https://betterbikeshare.org/2016/08/16/much-bike-share-ride-cost-system-lets-math/#:~:text=Also%20we%20left%20off%20the,to%20the%20number%20of%20trips.&text=Pretty%20stable.,to%20per%20member%20per%20year?&text=Of%20course%2C%20these%20figures%20vary,similar%20process%20to%20estimate%20theirs.
Beitsch, Rebecca. 2016. “Despite Popularity, Bike Share Programs Often Need Subsidies.” Stateline. Transportation. March 24, 2016. https://stateline.org/2016/03/24/despite-popularity-bike-share-programs-often-need-subsidies/#:~:text=In%20New%20York%2C%20Citigroup%2C%20the,who%20would%20run%20the%20program
Bluebikes. 2025. “Introducing the New Pillar Docking System at Bluebikes Stations.” Bluebikes.com. Last accessed December 8, 2025. https://bluebikes.com/blog/new-pillar-station
Bosselman, Andy. 2019. “BREAKING: Denver’s Bike Share Program Will Shut Down; City Will Shake up Scooter Program.” Streetsblog Denver. Urban Design. November 21, 2019. https://denver.streetsblog.org/2019/11/21/breaking-denvers-bike-share-program-will-shut-down-city-will-shake-up-scooter-program/
Citizen Portal AI. “City committee reviews request for 10-year Bluebikes operator contract starting 2026.” Citizen Portal AI. Boston City. June 18, 2025. https://citizenportal.ai/articles/6195389/Boston-City/Suffolk-County/Massachusetts/City-committee-reviews-request-for-10-year-Bluebikes-operator-contract-starting-2026
City of Boston. 2017. “Boston Today.” People’s Voice II: Boston in 2030. Projects and Policies. March, 2017. Last accessed December 8, 2025. https://www.boston.gov/sites/default/files/document-file-03-2017/go_boston_2030_-_3_boston_today_spreads.pdf#:~:text=During%20the%20peak%20hour%20of%20the%20morning,alone%2C%2083%2C000%20take%20transit%2C%20and%2036%2C000%20carpool
City of Boston. 2025. “Bluebikes.” City of Boston. Last updated October 30, 2025. https://www.boston.gov/departments/transportation/bluebikes#:~:text=Boston%20was%20among%20the%20first,4.7%20million%20in%202024%20alone.
City of Boston. 2025. “Boston’s Carbon Emissions.” City of Boston. Last updated October 30, 2025. https://www.boston.gov/departments/environment/bostons-carbon-emissions#:~:text=The%20increase%20from%202021%20Boston's%20emissions%20occurred,14%20to%208%20metric%20tons%20per%20year.
City of Cambridge “Bike Share Agreement by and between Motivate International Inc. and the City of Cambridge.” April 28, 2017. Publicly accessed record requested on November 3, 2025.
City of Redmond. 2017. “Bike Share Feasibility Study.” Redmond, Washington. March, 2016. https://altago.com/wp-content/uploads/Redmond-Final-Report.pdf
Clemens, Robert. 2025 “Bluebikes in the Past 5 Years.” ArcGIS StoryMaps. Last modified September 22, 2025. https://storymaps.arcgis.com/stories/e3828987a4ba4a938f742cbfd46407d8
D’Almeida, Tom Rye, Francesco Pomponi. 2021. “Emissions assessment of bike sharing schemes: The case of Just Eat Cycles in Edinburgh, UK.” Sustainable Cities and Society 71. No. 103012 (August): https://doi.org/10.1016/j.scs.2021.103012
Ding, Mengzhen, Shaohua Zhang, Lemei Li, Yishuang Wu, Qiyao Yang, and Jun Cai. 2025. “Environmental Benefits Evaluation of a Bike-Sharing System in the Boston Area: A Longitudinal Study” Urban Science 9, no. 5: 159. https://doi.org/10.3390/urbansci9050159
Famuyide, Stephanie. 2022. “How Much Does it Cost to Implement a Bikeshare System in 2022?” Business Analyst Learnings. February 3, 2025. https://www.businessanalystlearnings.com/business-matters/2022/2/3/how-much-does-it-cost-to-implement-a-bike-share-system-in-2022#:~:text=For%20people%20wanting%20to%20start,the%20total%20amount%20per%20year
Huang, Kevin. 2025. “Electric Bike vs Regular Bike: What's the Difference?” OKAI. March 21, 2025. https://okai.co/blogs/news/electric-bike-vs-regular-bike-whats-the-difference
Jagielski, David. 2025. “Up 60% This Year, Can Lyft's Stock Continue Rallying?” Nasdaq.com. The Motley Fool. November 1, 2025. https://www.nasdaq.com/articles/60-year-can-lyfts-stock-continue-rallying
Karpinski, Elizabeth. 2021. “Estimating the effect of protected bike lanes on bike-share ridership in Boston: A case study on Commonwealth Avenue.” Case Studies on Transport Policy 9. No. 3 (September): 1313-1323. https://doi.org/10.1016/j.cstp.2021.06.015
Li, Qiumeng, Franz Fuerst, Davide Luca. 2023. “Do shared E-bikes reduce urban carbon emissions?” Journal of Transport Geography 112, no. 103697 (October): https://doi.org/10.1016/j.jtrangeo.2023.103697
Massachusetts Bay Transportation Authority. “Ridership on the T.” MBTA. Accessed December 8, 2025. https://www.mbta.com/performance-metrics/ridership-the-t
McCauley, Alicia. 2017. “What’s More Efficient Than a Person on a Bike?” Bike New York. April 21, 2017. https://www.bike.nyc/blog/news/how-cyclists-beat-every-other-moving-creature-and-machine/#:~:text=The%20findings%20reveal%2C%20%E2%80%9CThe%20rate,bikes%20from%20any%20plausible%20deniability.&text=This%20study%20is%20from%201973,Post%20by%20Alicia%20McCauley
Metropolitan Area Planning Council. 2025. “Request for Proposals: Bikeshare Services.” MPAC Bicycle Share Services: Fundraising, Operations, Marketing, and Equipment Services. April, 2025. Last accessed December 8, 2025. Publicly accessed record requested on November 3, 2025.
MilNeil, Christian. 2023. “Mayor Wu’s 2024 Budget Proposal Includes $1.4 Million for Electric Bluebikes” StreetsBlogMass. Advocacy opportunities. April 10, 2023. https://mass.streetsblog.org/2023/04/10/mayor-wus-2024-budget-proposal-includes-1-4-million-for-electric-bluebikes
MilNeil, Christian. 2024. “Federal Funds Will Let Bluebikes System Add Electrified Stations For E-Bikes.” StreetsBlogMass. Bikesharing. October 22, 2024. https://mass.streetsblog.org/2024/10/22/federal-funds-will-let-bluebikes-system-add-electrified-stations-for-e-bikes
MilNeil, Christian. 2025. “Lyft’s bid aims for ‘50 percent growth in ridership, reaching 7 million annual trips by Year 3 of the new contract.” StreetsBlogMass. Bicycling. October 31, 2025. https://mass.streetsblog.org/2025/10/31/more-e-bikes-more-rides-details-from-lyfts-bluebikes-contract-proposal
PRNewswire. 2023. “Greater Boston Municipal Leaders and Blue Cross Blue Shield of Massachusetts Announce Addition of Bluebikes' Next-Gen Ebikes.” Newsroom. Blue Cross Blue Shield. December 21, 2023. https://newsroom.bluecrossma.com/2023-12-21-Greater-Boston-Municipal-Leaders-and-Blue-Cross-Blue-Shield-of-Massachusetts-Announce-Addition-of-Bluebikes-Next-Gen-Ebikes#:~:text=Blue%20Cross%20Blue%20Shield%20of%20Massachusetts%20(BCBSMA),Cambridge%20*%20Everett%20*%20Somerville%20*%20Brookline
Sheng, Susan. 2021. “Bike Lanes and Local Business: The Economic Impact.” Cambridge Bicycle Safety. Facts, Reports + Studies. September 22, 2021. https://www.cambridgebikesafety.org/2021/09/22/bike-lanes-and-local-business-the-economic-impact/
Tran, Susan. 2023. “Inside Boston’s Changed: How Traffic's Changed at Rush Hour and More.” NBC 10 Boston. January 26, 2023. https://www.nbcboston.com/news/local/inside-bostons-changing-commute/2956180/
Vanderbilt, Tom. 2023. “How Electric Docks Could Supercharge Bikeshare.” Lyft. Impact. October 11, 2023. https://www.lyft.com/blog/posts/ebike-charging-electric-bike-share
Wang, Yuting. Shouheng Sun. 2022. “Does large scale free-floating bike sharing really improve the sustainability of urban transportation? Empirical evidence from Beijing.” Sustainable Cities and Society 76. No. 103533 (January): https://www.sciencedirect.com/science/article/pii/S221067072100799X?via%3Dihub#sec0019
Zipper, David. 2023. “Undoing Bikeshare’s Original Sin.” Fastcompany.com. Impact. April 18, 2023. https://www.fastcompany.com/90883010/undoing-bikeshares-original-sin